


WONDER 3.0 - Monitoring. Evaluating. Optimizing. Reporting.
WONDER 3.0 supports you energetically and comprehensively in the operational management of your wind parks.
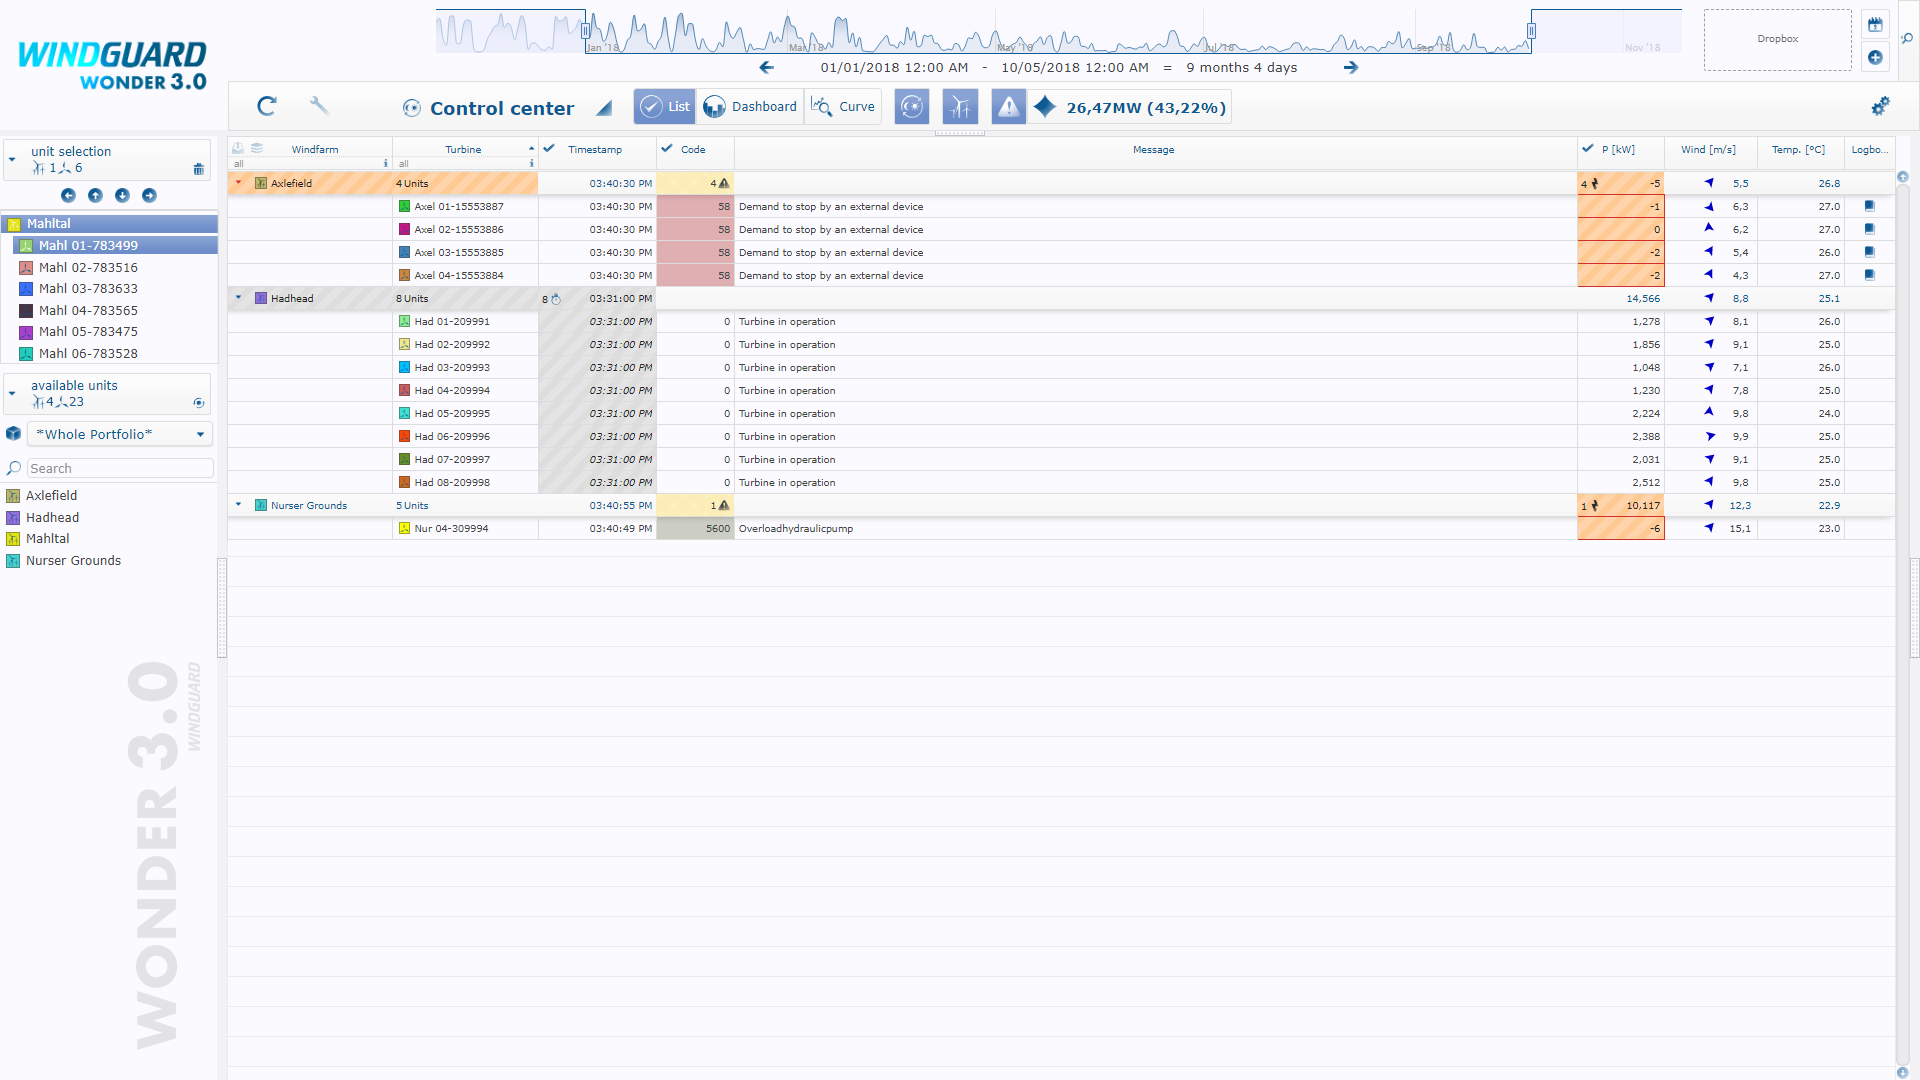
In the Control center, you always have all the information at a glance. Faults are highlighted so you can respond immediately. Powerful evaluation modules help you to find the cause.
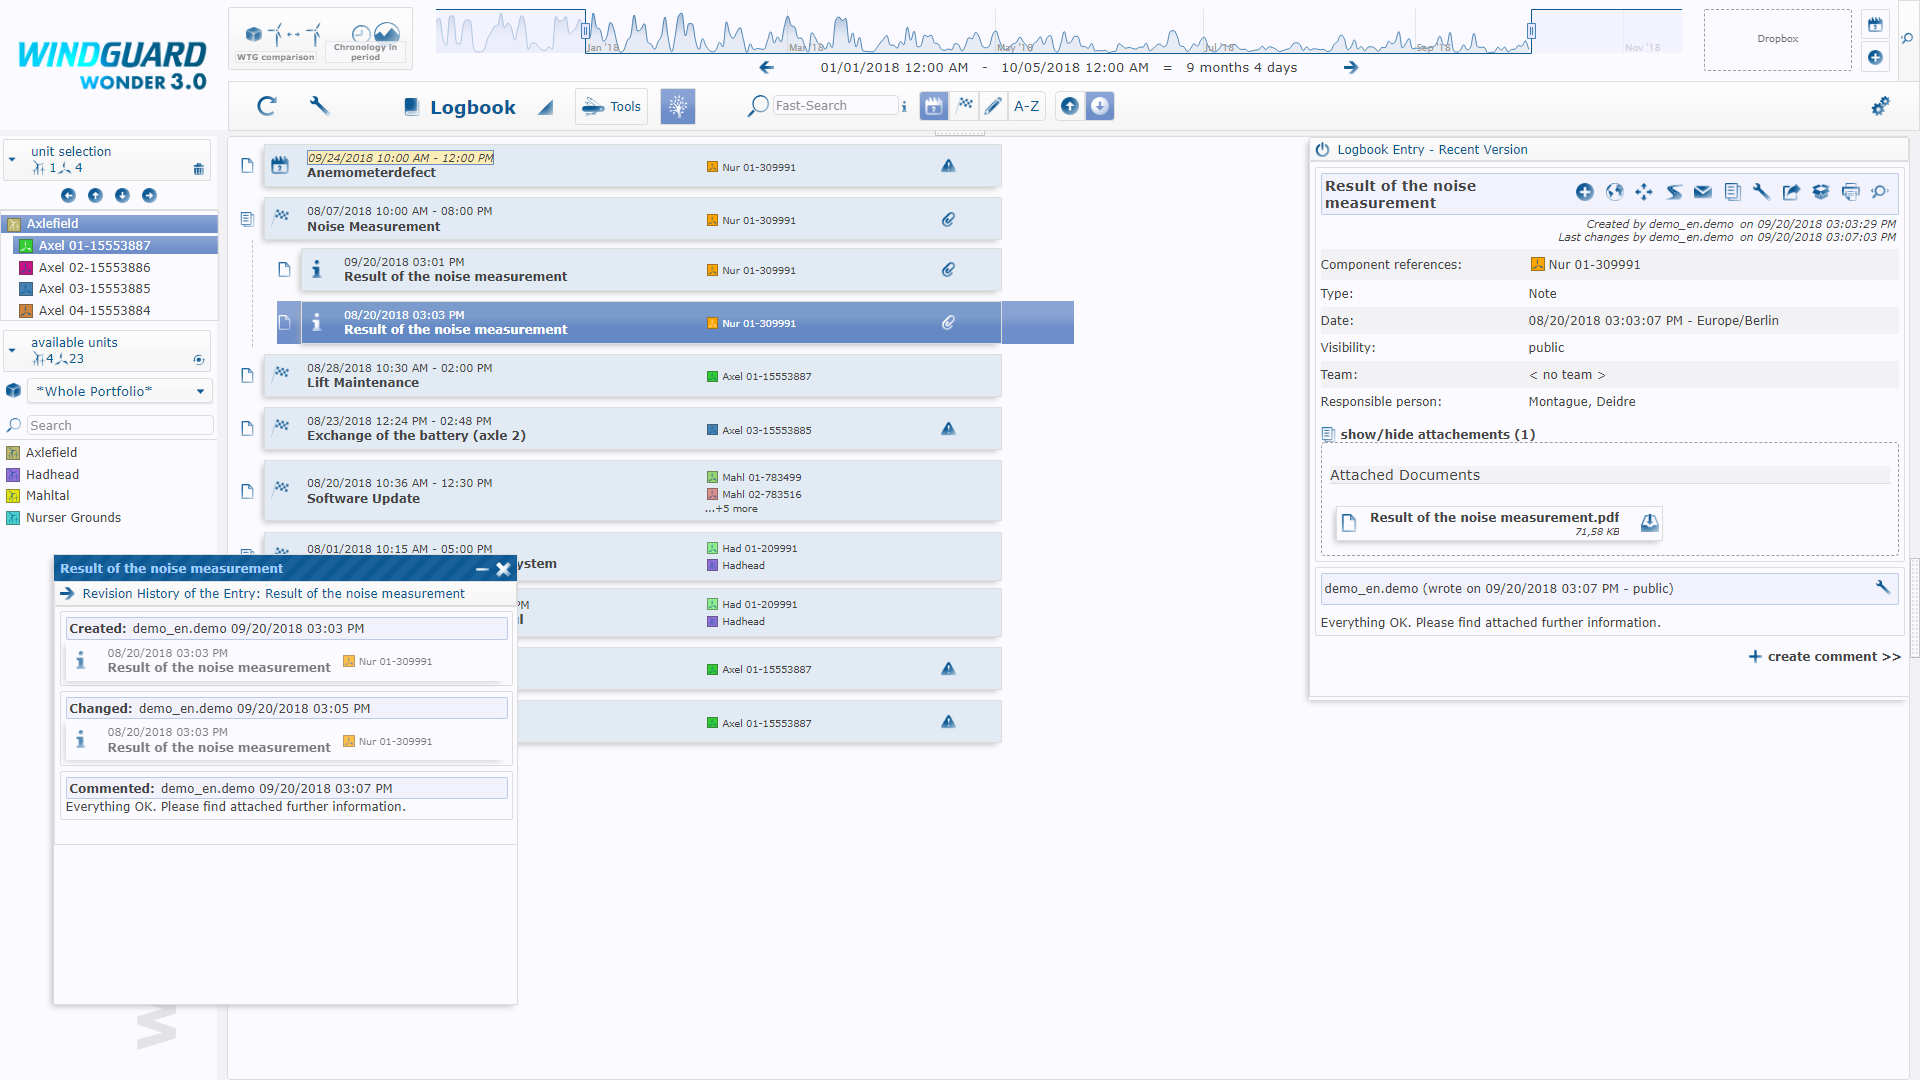
The Logbook is a coordination tool when trouble shooting. All the information is bundled and provided to the involved crafts in an apposite way. All maintenance, inspection and measurements can also be managed and documented in the Logbook.
WONDER features fully automated data retrieval. The Control center displays the current operating values of the wind turbines. In the Alarmlog all messages received from the wind turbines are listed.
A special monitoring module is the Watchdog: this detects potential faults and disturbances of the wind power plants by analysing their behaviour. For example, if a turbine is not in production mode, even if there is sufficient wind, or a data channel exceeds a designated interval the watchdog actively signals this potential issue.
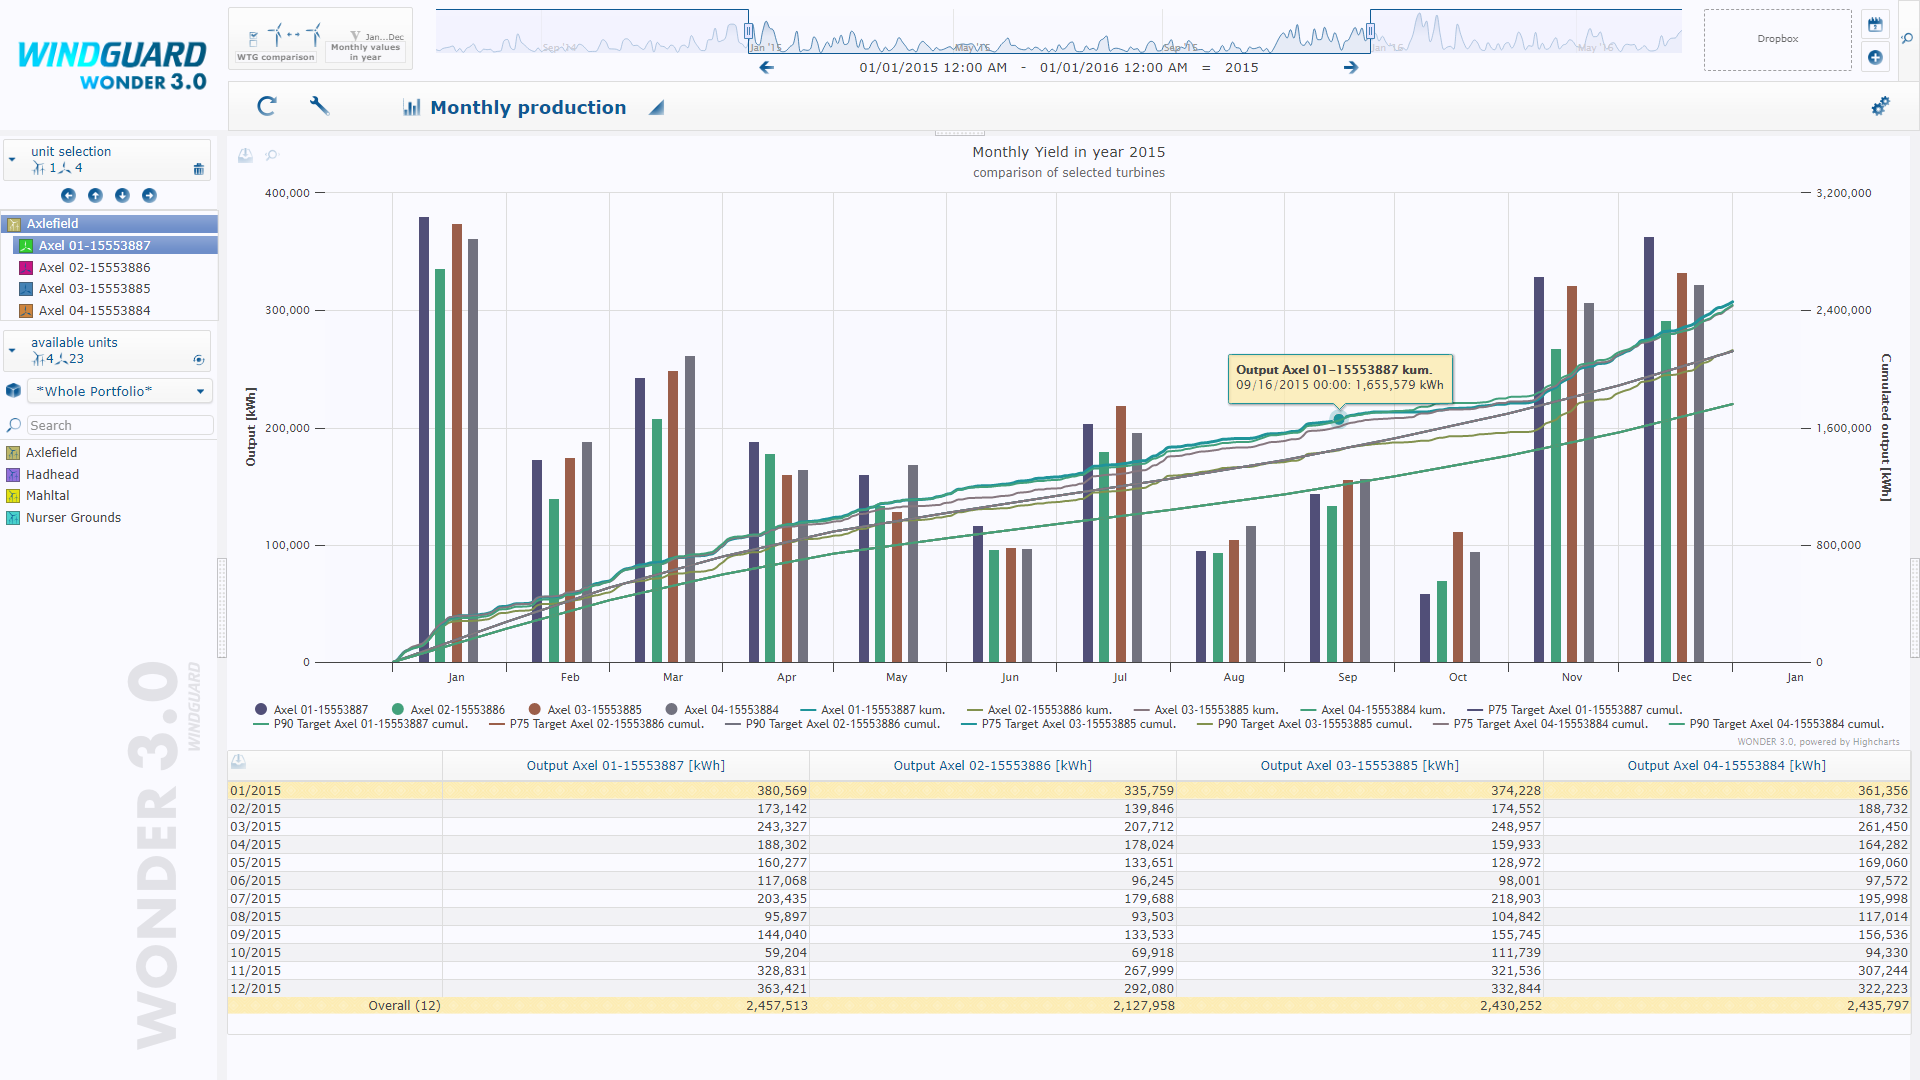
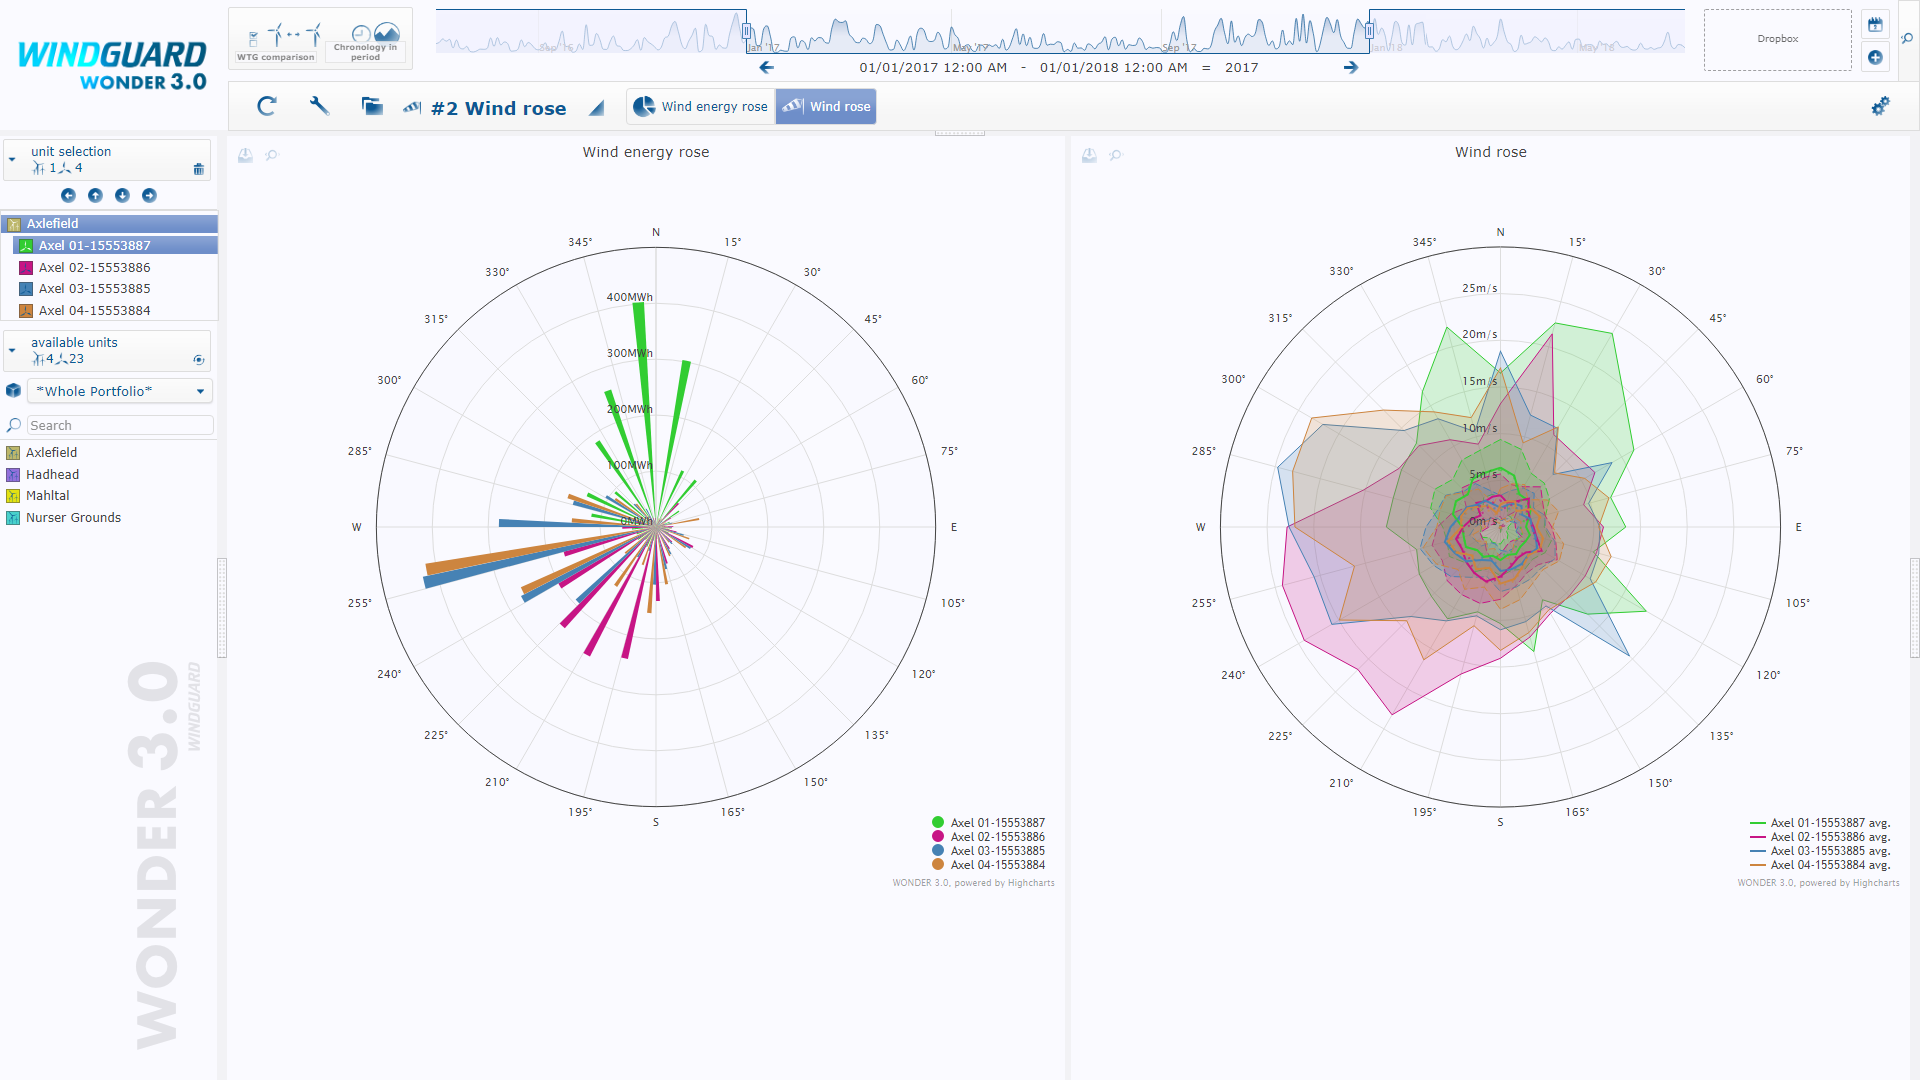
Among the numerous evaluation modules you will always find the right analysis tool: In addition to the classics – including Target/performance comparison, Availabilities, Wind rose and Power curve - many specialized modules are also available: For example, you get support from the module Curtailment loss (peak algorithm) for the billing if using feed-in measures. The module Production loss visualizes the increase of realized yield and lost yield due to standstills for a configurable period.
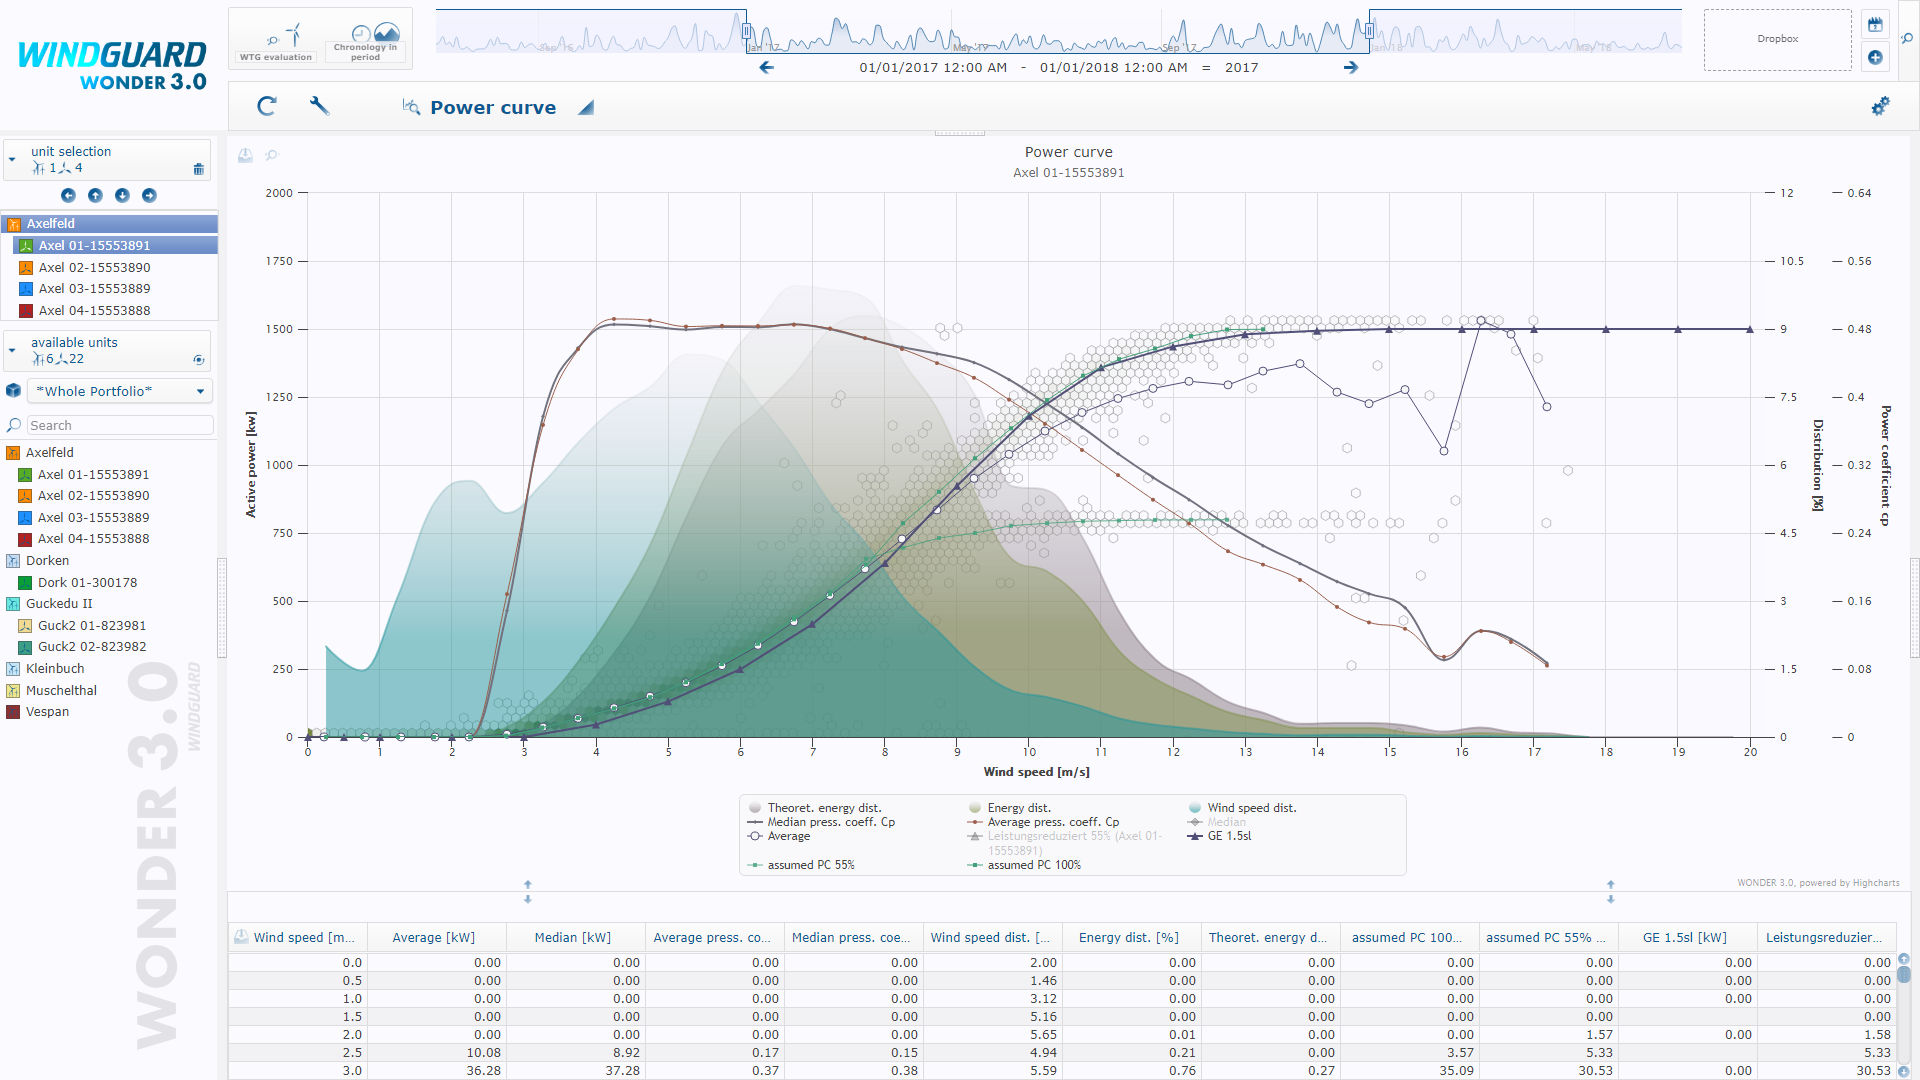
If the projected energy yield is not reached, WONDER offers a lot of help to identify the cause. In the Power curve the real operating behaviour can be compared with the manufacturer's specifications.
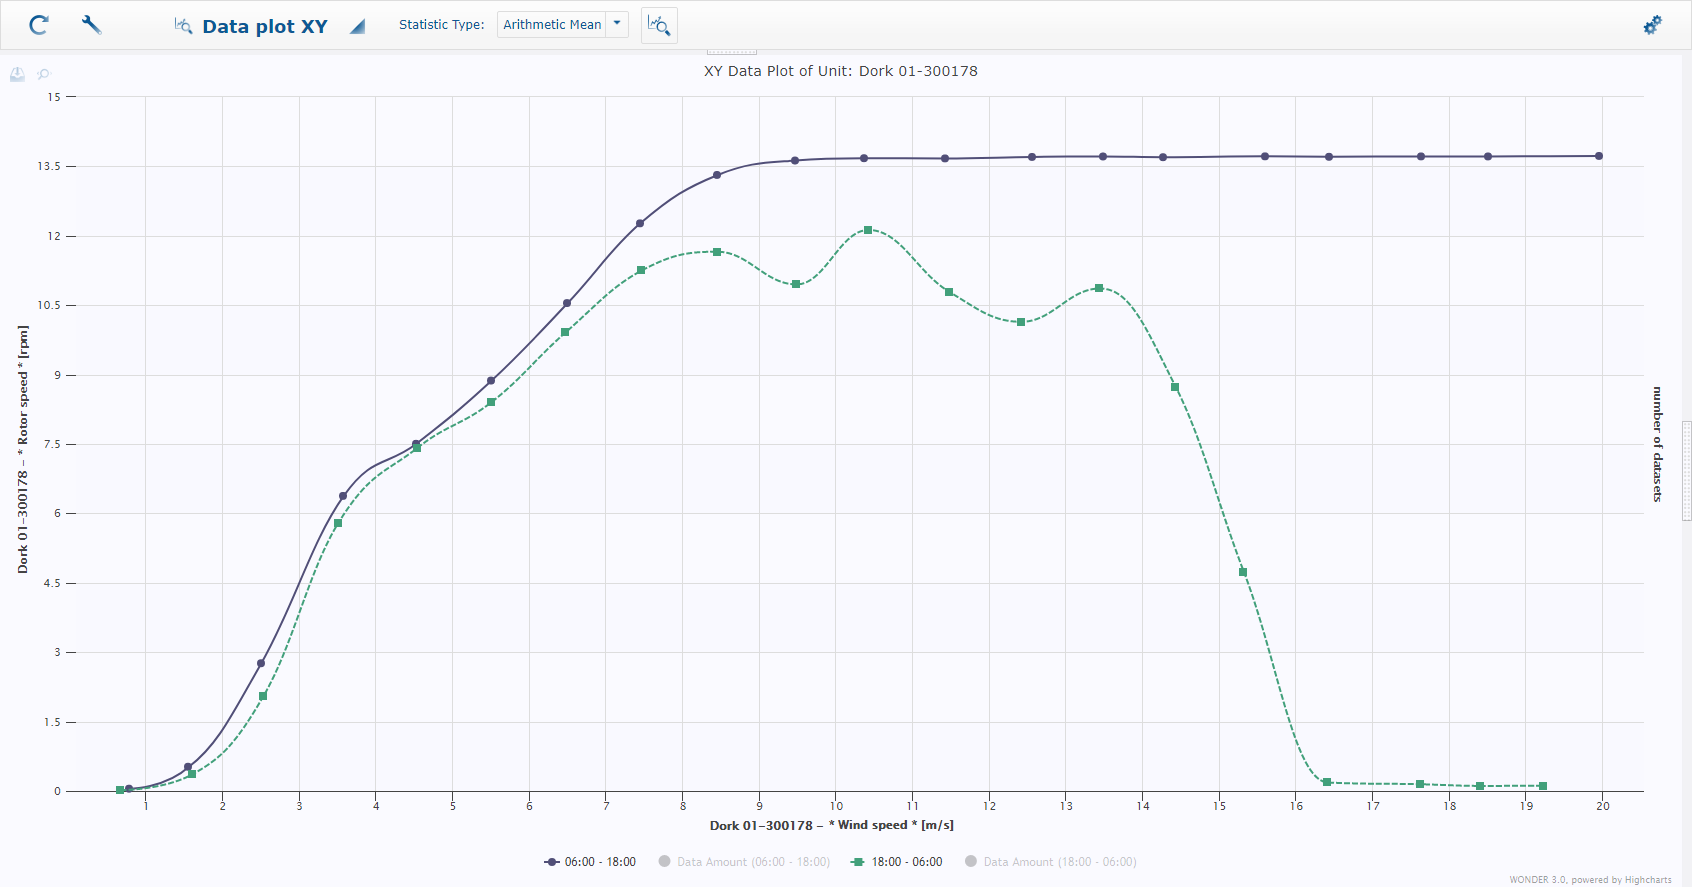
Next to the Power curve, further operating curves can be customized using the module Data plot XY. Therein, the function of any two operating data channels is accessible. For example, the generator temperature can be visualized as a function of the feed-in power.
The proper functionality of wind turbine systems can also be checked. Thus, figure 6 shows the rotor speed as a function of the wind speed. The green curve applies to night hours and shows a speed-reduced low-noise night mode.
All procedures for maintenance, inspections, measurements and repair can be coordinated in the Logbook. All participants have access to the necessary information and documents. If you do not have access to the WONDER frontend, logbook entries can also be added via an e-mail interface.
You can manage all components of the wind energy systems in the module Components. The components are marked according to the international RDS-PP® power plant standard. The marking system supports you during the entire life cycle of the wind power plants - during operation and maintenance.
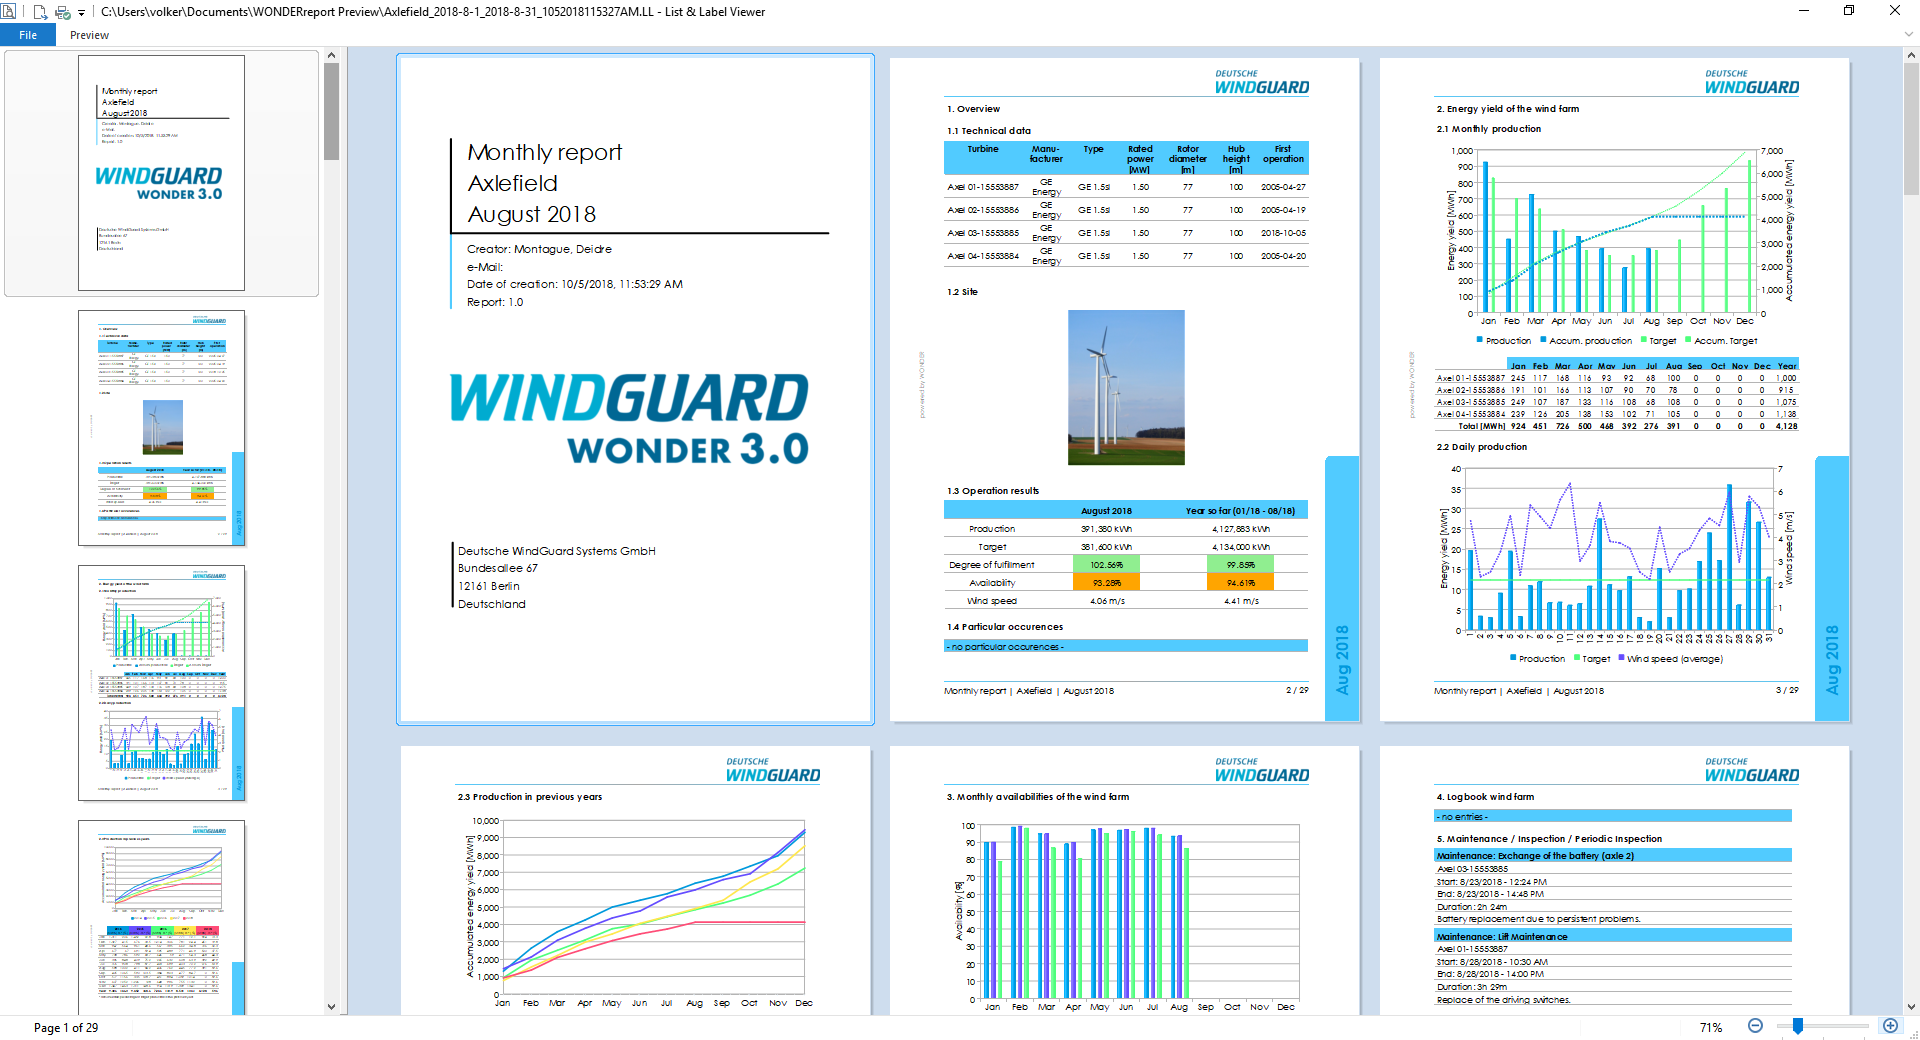
Create monthly, annual or weekly reports with the List & Label Designer according to your own ideas and requirements.
The combit Report Designer has won many awards. With this report generator, you can implement all your individual requirements in the report.
Once the report is created, the data for the current month, year or week can be updated with just a few mouse clicks.
WONDER also provides basic built-in reporting capabilities.
If you still want more:
WONDER will provide all the operating values and functions via application programming interfaces.
Thus, WONDER leaves every option open - both for customizing and for linking to your own software system.