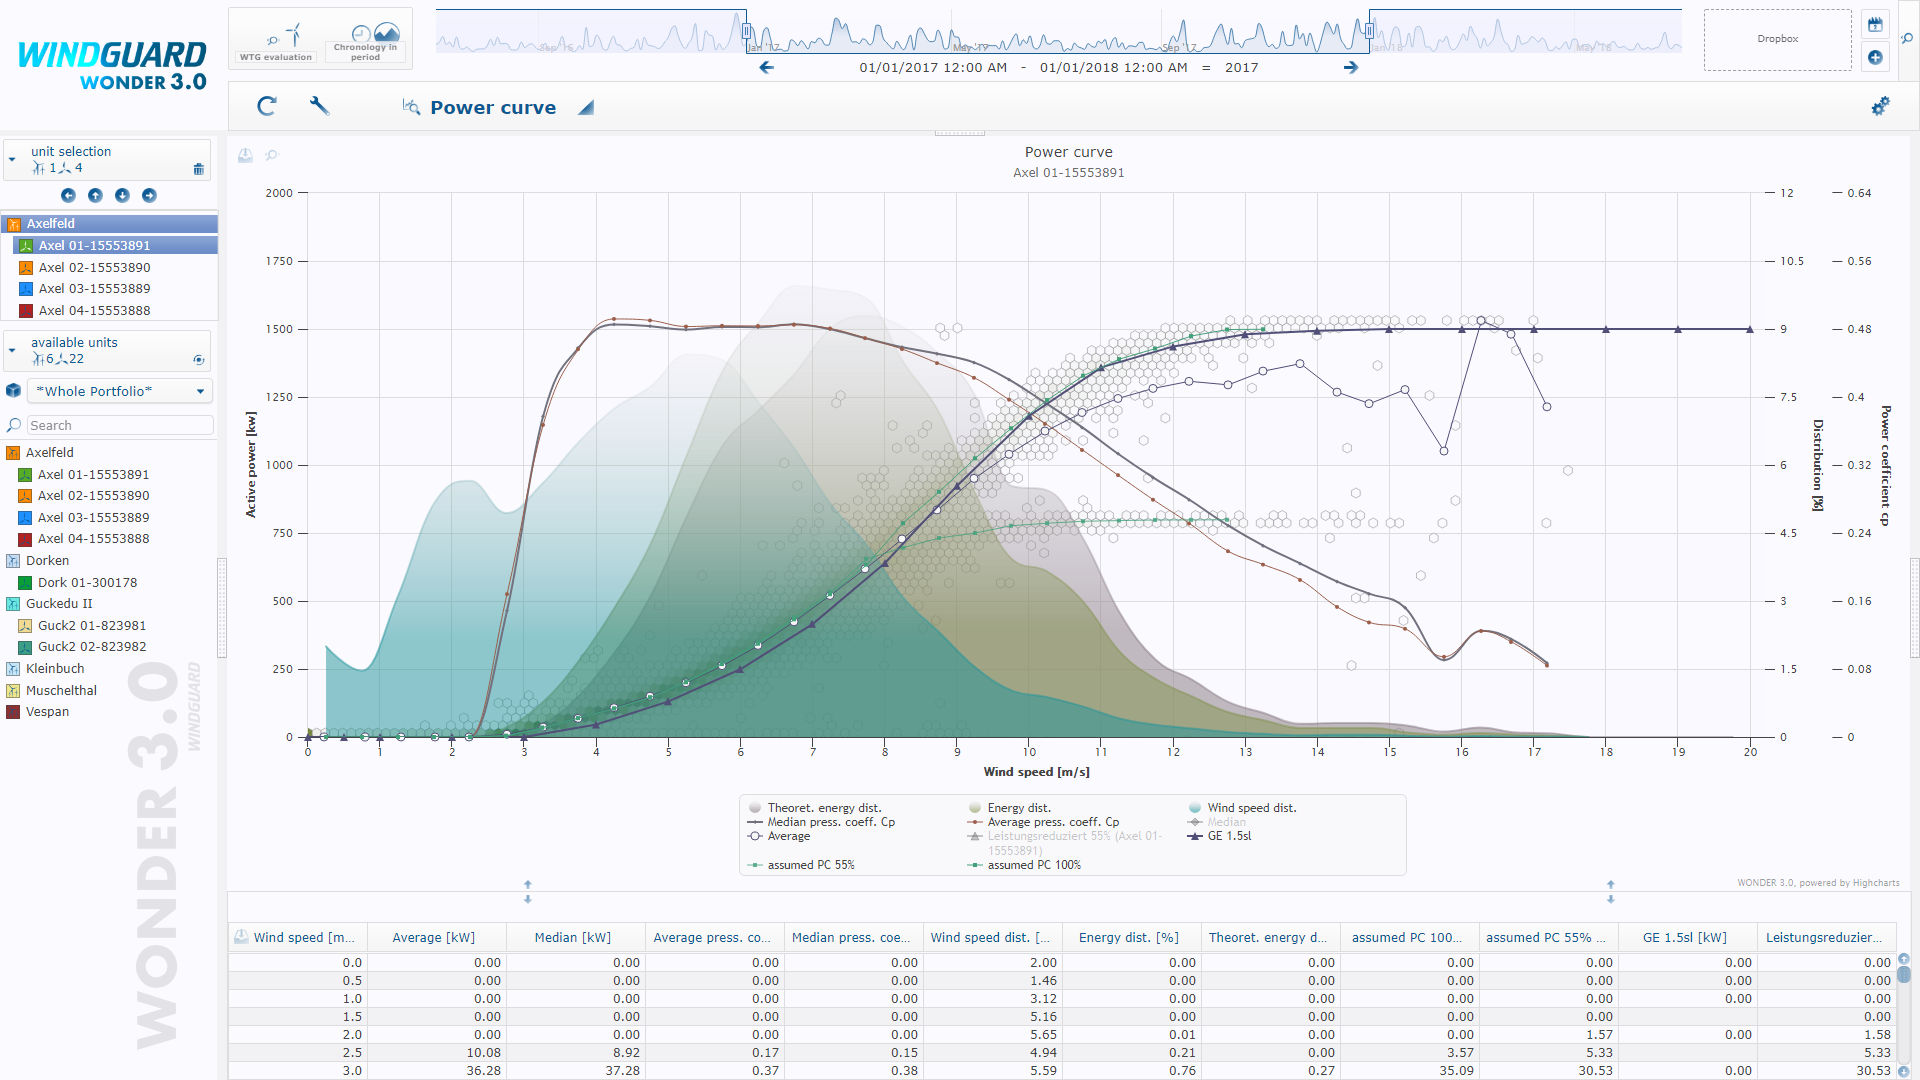


Power curve
Visualization and comparison of the actual measured power curve and its reference.
The reference power curve that is given by the manufacturers slightly differs often from the real behaviour of the wind energy turbine. Mismatches and offsets will be only visible if the actual measured data cloud is rendered beside the reference curves.
This module does exactly the job for you and adds the wind and energy distribution together with the Cp values to the chart. Furthermore, a WONDER internal algorithm interpolates the actual existing power curves that most likely also contain throttled plant conditions.
Those throttlings would have effected the classical calculation methods mistakenly (e.g. mean or average).